 D&D or Pathfinder? That’s a question which has done the rounds. The market stats from ICv2 seem to have been telling a consistent story over recent years; Pathfinder rises and Dungeons & Dragons drops. The latest survey suggested D&D was in 4th place.
There’s a catch though. It’s not just that few groups were buying D&D 4e given that D&D 5e was around the corner. It’s also because many gaming groups were happy with their current games and still playing. Which RPGs are gamers actually playing?
Roll20, the virtual tabletop software, run by The Orr Group is in the position to find out what RPGs gamers are playing. They didn’t snoop on games; they simply asked analysed the profiles of some of their 600,000 free users. By the way; 600,000 gamers in the virtual tabletop community! That’s pretty good!
Roll20’s research shows that D&D has a commanding lead. In a straight head to head between D&D 3.5 and Pathfinder when gamers were asked what which game they were happy to play; 43%.48% said Pathfinder and a little more, 44.96%, said D&D 3.5e. So when you add in gamers on D&D 5e already or sticking with D&D 4e the lead becomes substantial.
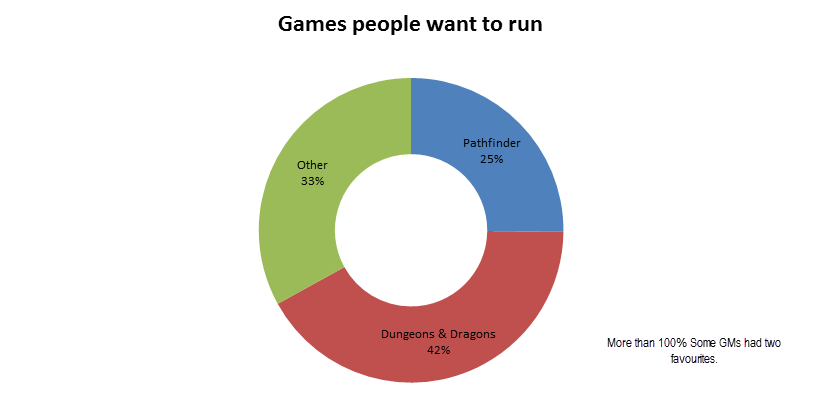
Roll20 didn’t stop their survey there. They also asked which games people wanted to run. Pathfinder came out top with 26.83% of GMs responding and D&D 3.5 was in second place at 17.87%. Add up all the variants and once again Dungeons & Dragons has a commanding lead.
You can see the raw figures from Roll20 here.
| Game Title | Game % | Player % |
|---|---|---|
| Pathfinder | 26.83% | 43.48% |
| D&D 3.5E | 17.87% | 44.96% |
| D&D 5E | 12.08% | 16.61% |
| D&D 4E | 11.31% | 24.92% |
| Star Wars RPGs (Any Edition) | 2.66% | 12.66% |
| AD&D (1st Edition and 2E) | 2.65% | 12.12% |
| Dark Heresy | 2.52% | 10.06% |
| Shadowrun (Any Edition) | 2.33% | 12.22% |
| Dungeon World | 2.17% | 4.41% |
| Warhammer 40k | 1.91% | 10.23% |
| Savage Worlds | 1.74% | 4.55% |
| World of Darkness | 1.60% | 10.10% |
| FATE (Any Edition) | 1.57% | 3.97% |
| GURPS | 1.47% | 5.33% |
| Call of Cthulhu (Any Edition) | 1.41% | 8.76% |
| Numenera | 1.09% | 3.12% |
| 13th Age | 1.05% | 1.65% |
| Vampire: The Masquerade | 0.80% | 6.99% |
| Story Games | 0.77% | 3.57% |
| Old School Revival (OSR) | 0.75% | 1.47% |
| New World of Darkness | 0.74% | 4.81% |
| Mutants and Masterminds | 0.70% | 3.91% |
| Original D&D | 0.69% | 3.86% |
| White Wolf (Any Game) | 0.64% | 5.41% |
| Warhammer Fantasy | 0.61% | 4.91% |
| Dragon Age RPG | 0.43% | 3.16% |
| A Song of Ice and Fire | 0.40% | 2.52% |
| Traveller (Any Edition) | 0.39% | 2.34% |
| Palladium Games | 0.34% | 2.86% |
| Fiasco | 0.17% | 1.72% |
| Mouse Guard RPG | 0.14% | 1.13% |
| Gamma World | 0.11% | 1.91% |
| Other | 6.69% | 12.56% |
Notice some overlaps? I asked Roll20 about this and it’s easy to understand; this was an open text survey. Gamers could mention any game they wanted. So when you see “New World of Darkness” as well as “Any White Wolf” that means a statistically significant chunk of gamers called out “New World of Darkness” explicitly while another told the survey that any White Wolf game would do.
The Orr Group provide the following notes;
- “Games” = % of games where the Game Master said “this is what we’re playing.”
- “Players” = % of players who were active in the quarter and filled in the “this is what I enjoy playing” field on their profile.
- Percentages will total more than 100% because each player/game can have more than one game type designated. This is extremely common for players and rare for the games.
- This only takes into account games/players which were active (e.g. game was played, player played at least one game) during the 3rd Quarter of 2014.
- This is meant to be a representative sample, as it only takes into account games and players who filled out relevant fields on their game page/profile. There was significantly more than 25k games and 15k players who played in this quarter, but many do not fill out these fields.
- The list of available games to select were curated by Roll20’s staff based on previous free-form survey results, and will be changing in the future.
Update: Post has been updated to better reflect Roll20’s methodology. There was an original, previous, freeform survey which produced the list of games players could select. The 15,000 analysis that this research is base on is a direct report on which RPGs players had identified on their Roll20 profiles.
Picture credit: Batty Brandyn of Deviant Art.


